Dashboard
The dashboard is the landing page of the admin panel (route /). It gives administrators a summary of tenant activity and direct access to each management section.
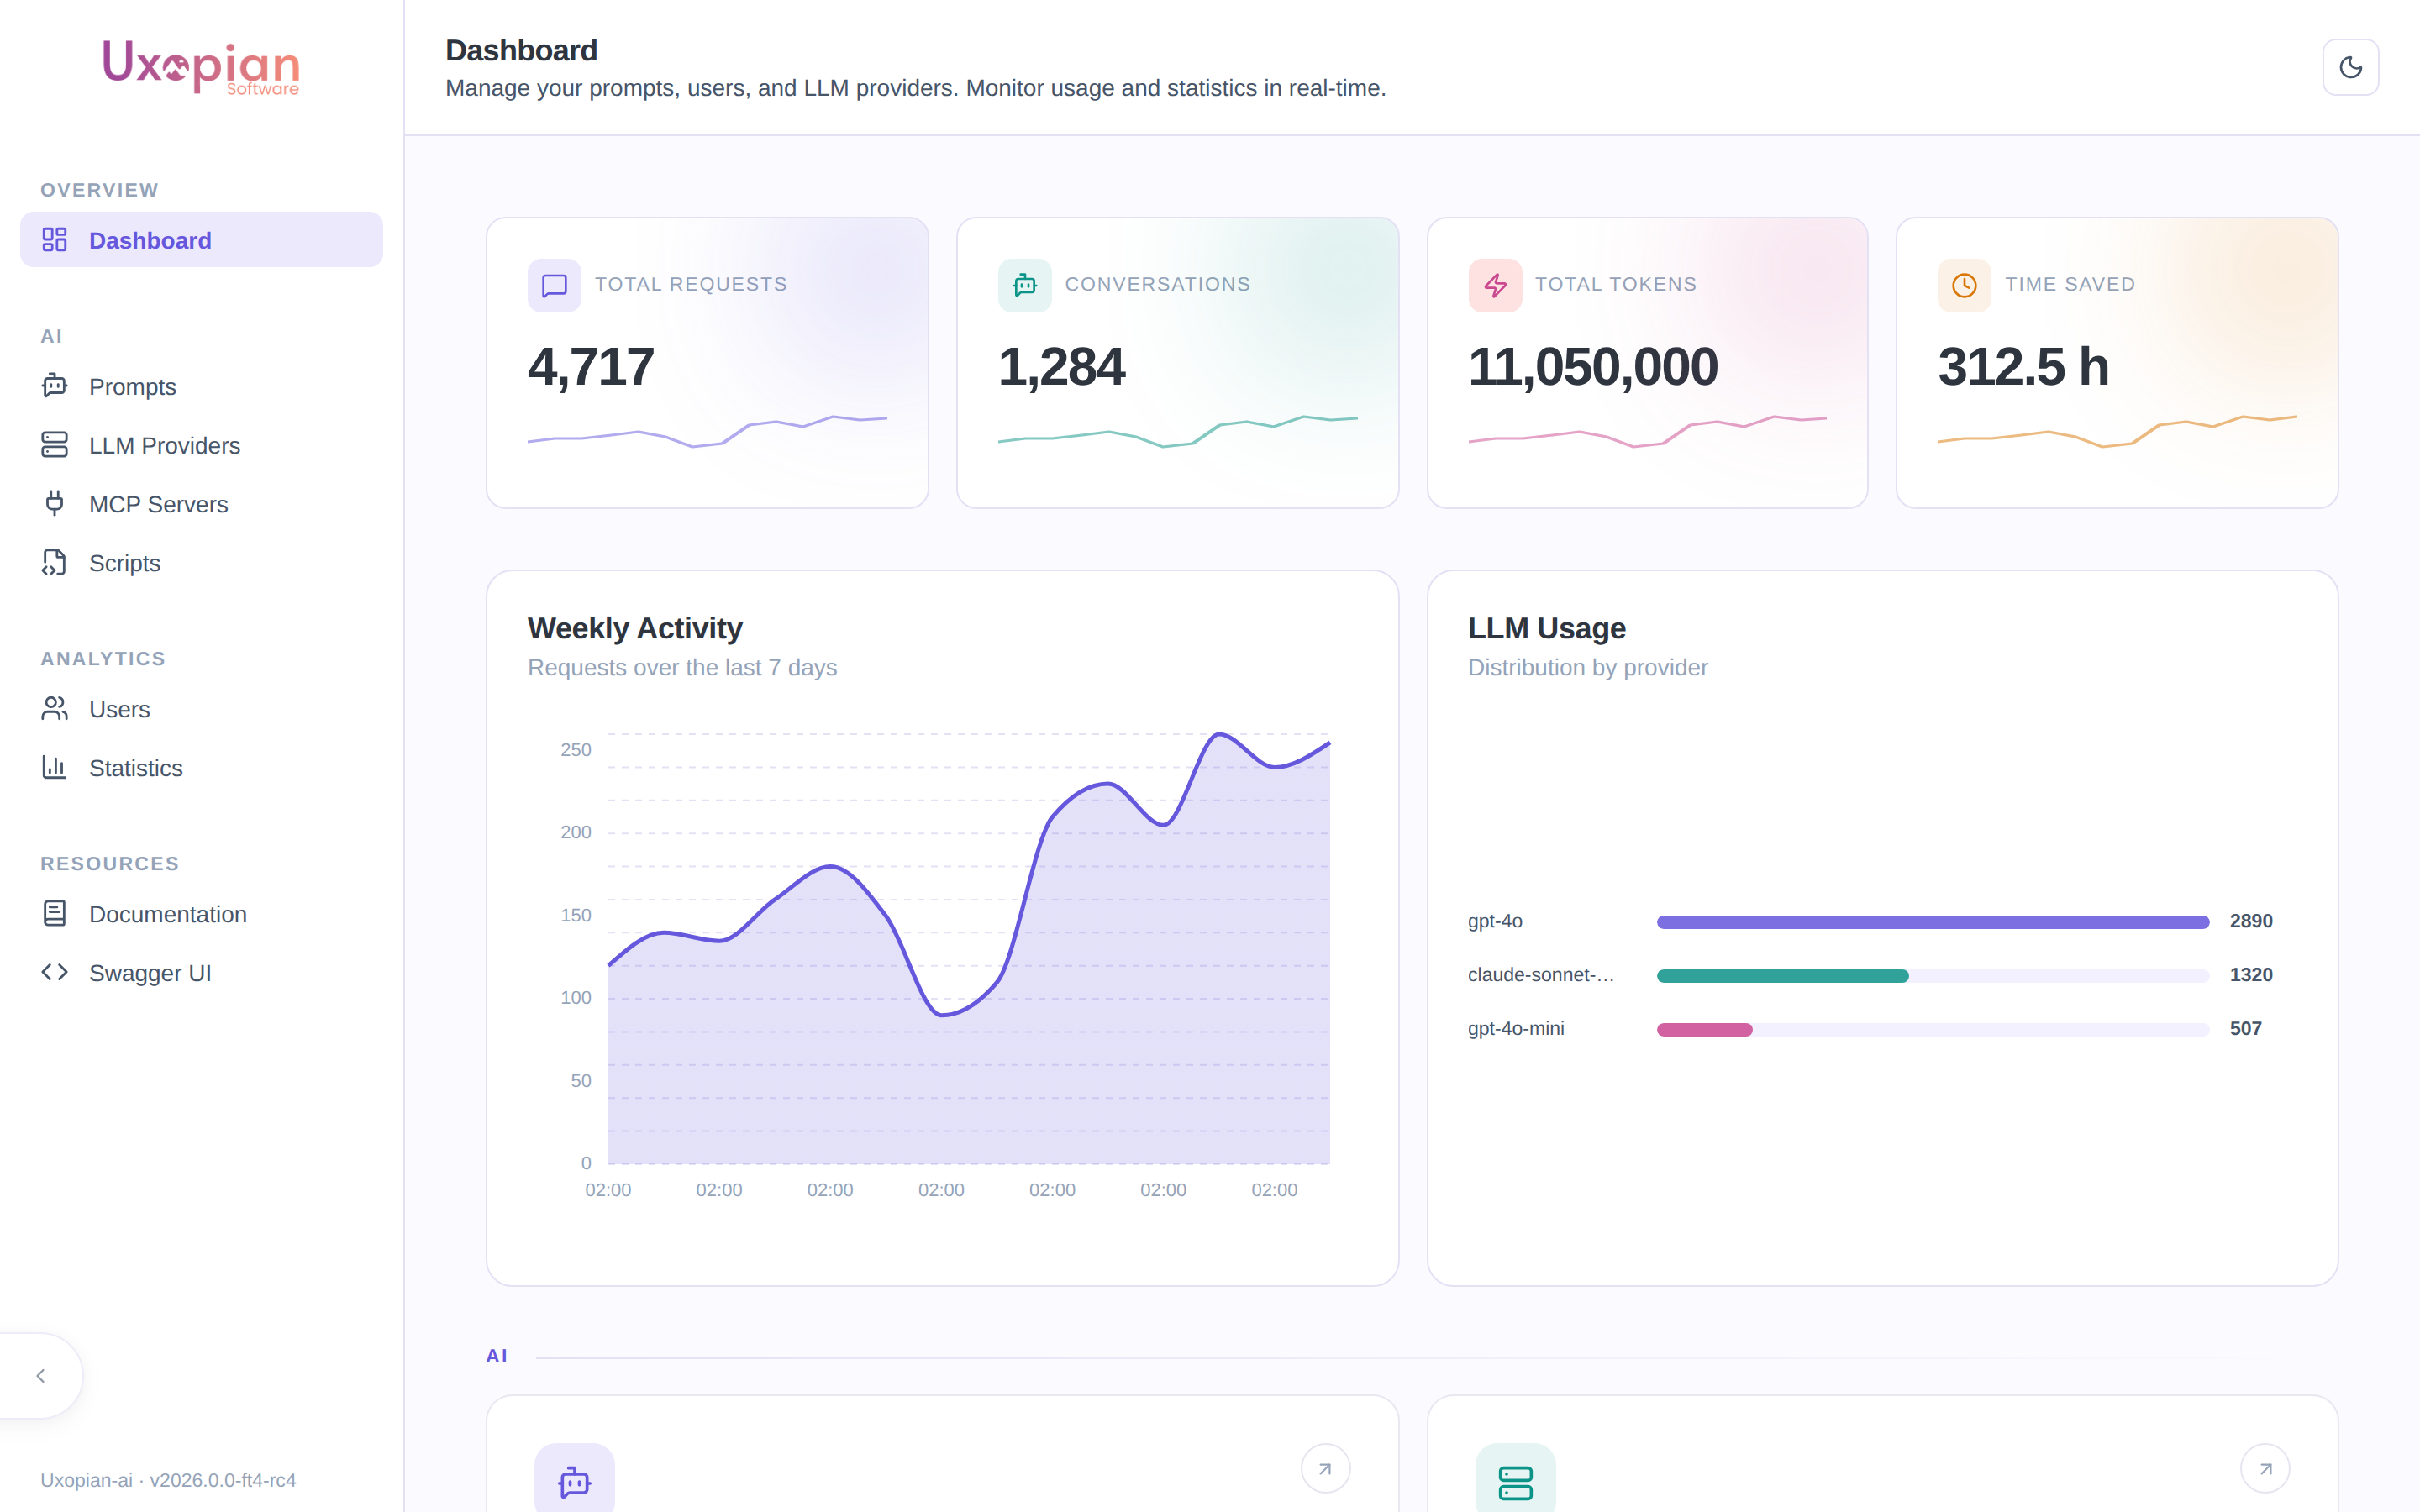
Figure: the dashboard — summary cards, weekly activity, and LLM usage distribution.
Stats cards
Four cards are displayed at the top with sparkline charts:
| Card | Description |
|---|---|
| Total requests | Number of LLM requests processed |
| Conversations | Number of distinct conversations |
| Total tokens | Sum of input and output tokens |
| Time saved | Cumulative time saved across all prompts (hours) |
Data is fetched from GET /api/v1/admin/stats/global.
Activity charts
Below the stats cards, two charts show recent activity:
- Time series: request volume over recent days.
- LLM distribution: model usage breakdown by provider.
Both charts use the same Stats API endpoints as the full Statistics page, with a default DAY interval.
Figure: Dashboard layout and navigation targets.
Feature cards
A grid of cards links to the admin sections:
| Card | Section | Target route |
|---|---|---|
| Prompts | AI | /prompts |
| LLM Providers | AI | /llm-providers |
| Users | Analytics | /users |
| Statistics | Analytics | /statistics |
Resource links
Two external links are displayed at the bottom of the feature grid:
- Documentation: opens the product documentation site.
- Swagger UI: opens the interactive API explorer at the configured API endpoint (
/swagger-ui/index.html).