Monitoring statistics
The statistics section of the admin panel displays usage metrics for the current tenant. Data is read from OpenSearch via the Stats API (/api/v1/admin/stats).
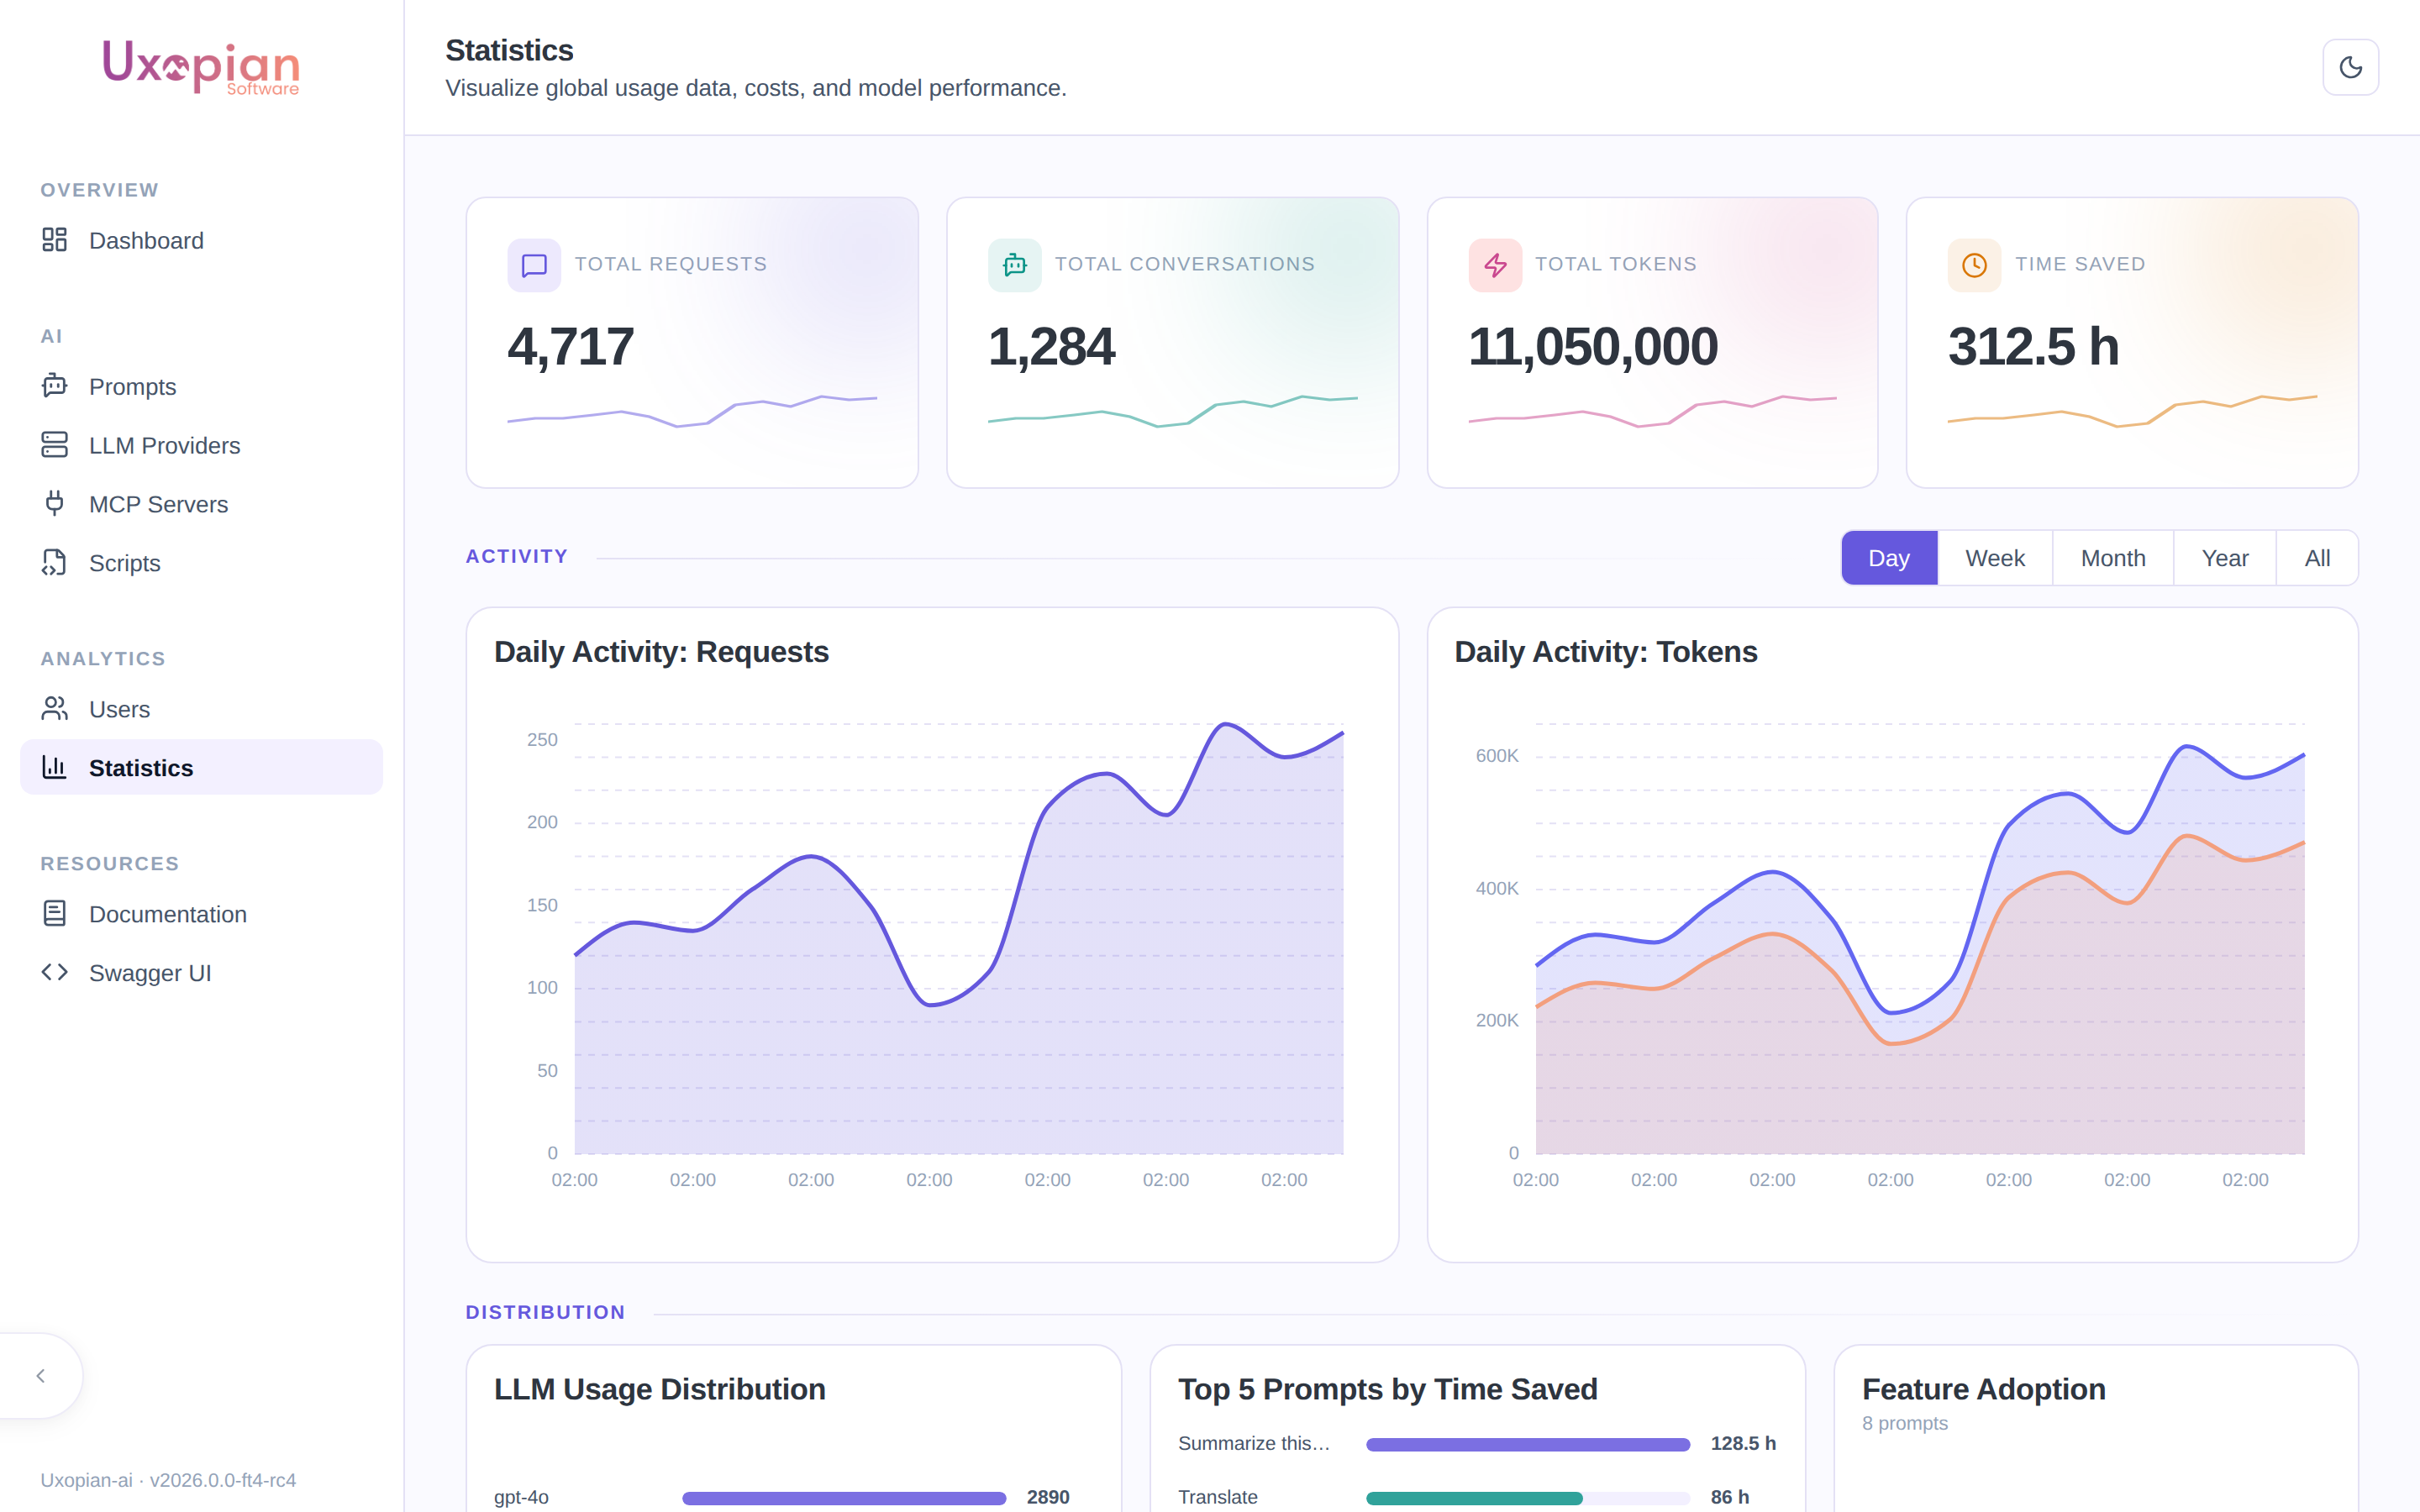
Figure: the statistics page — overview cards, daily activity, LLM distribution, top prompts by time saved, and feature adoption.
Available statistics
Global stats
The dashboard shows aggregated totals:
- Total conversations
- Total requests
- Total tokens (input + output)
- Estimated time saved
Fetched from GET /api/v1/admin/stats/global.
Time interval selector
A toolbar at the top of the statistics page lets you select the time granularity. The selected interval applies to all charts on the page.
| Button | Interval | Description |
|---|---|---|
| Day | DAY | Daily buckets (default) |
| Week | WEEK | Weekly buckets |
| Month | MONTH | Monthly buckets |
| Year | YEAR | Yearly buckets |
| All | none | All-time aggregation, no interval filter |
Activity charts
Two area/line charts show activity over the selected interval:
- Requests: request volume over time.
- Tokens: token usage (input + output) over time.
Fetched from GET /api/v1/admin/stats/timeseries?interval={interval}.
LLM distribution
A chart showing which LLM models were used for requests, with counts per provider. The interval selector applies to this chart as well.
Fetched from GET /api/v1/admin/stats/llm-distribution?interval={interval}.
Top prompts by time saved
Ranks the top 5 prompts by cumulative time saved (displayed in hours). This helps identify which prompts deliver the most value.
Fetched from GET /api/v1/admin/stats/top-prompts-time-saved?interval={interval}.
Feature adoption
Shows adoption rates for advanced capabilities:
| Feature | Description |
|---|---|
| Multimodal | Percentage of requests using image inputs |
| Function calling | Percentage of requests using tool calling |
Fetched from GET /api/v1/admin/stats/feature-adoption.
Figure: Statistics page layout and data flow.
PDF export
Click the "Export PDF" button at the top of the statistics page to download the current dashboard view as a PDF file. The export includes all visible charts and summary cards.
Metrics export to OpenSearch
Uxopian AI exports custom metrics to OpenSearch via the Micrometer Elastic exporter, configured in metrics.yml. The default index is micrometer-metrics. Standard JVM, HTTP, and system metrics are disabled by default to reduce noise.
To enable additional metrics, edit metrics.yml:
management:
  metrics:
    enable:
      jvm: true       # Enable JVM metrics
      http: true      # Enable HTTP request metrics
Actuator endpoints
Three actuator endpoints are exposed over HTTP:
| Endpoint | Path | Description |
|---|---|---|
| Health | /actuator/health | Application health (public) |
| Info | /actuator/info | Build and version info |
| Loggers | /actuator/loggers | View and change log levels at runtime |
The health endpoint is public in the default gateway configuration. Other actuator endpoints should be protected in production.
REST API endpoints
| Method | Endpoint | Description |
|---|---|---|
GET | /api/v1/admin/stats/global | Global aggregated statistics |
GET | /api/v1/admin/stats/timeseries?interval={interval} | Activity time series |
GET | /api/v1/admin/stats/llm-distribution?interval={interval} | LLM model usage distribution |
GET | /api/v1/admin/stats/top-prompts-time-saved?interval={interval} | Top 5 prompts by time saved |
GET | /api/v1/admin/stats/feature-adoption | Feature adoption rates |