Dashboard
The dashboard is the landing page of the admin panel (route /). It greets the signed-in user, shows the tenant, and gives administrators a summary of the tenant's activity over the last week. The other sections are reached from the navigation rail, not from the dashboard.
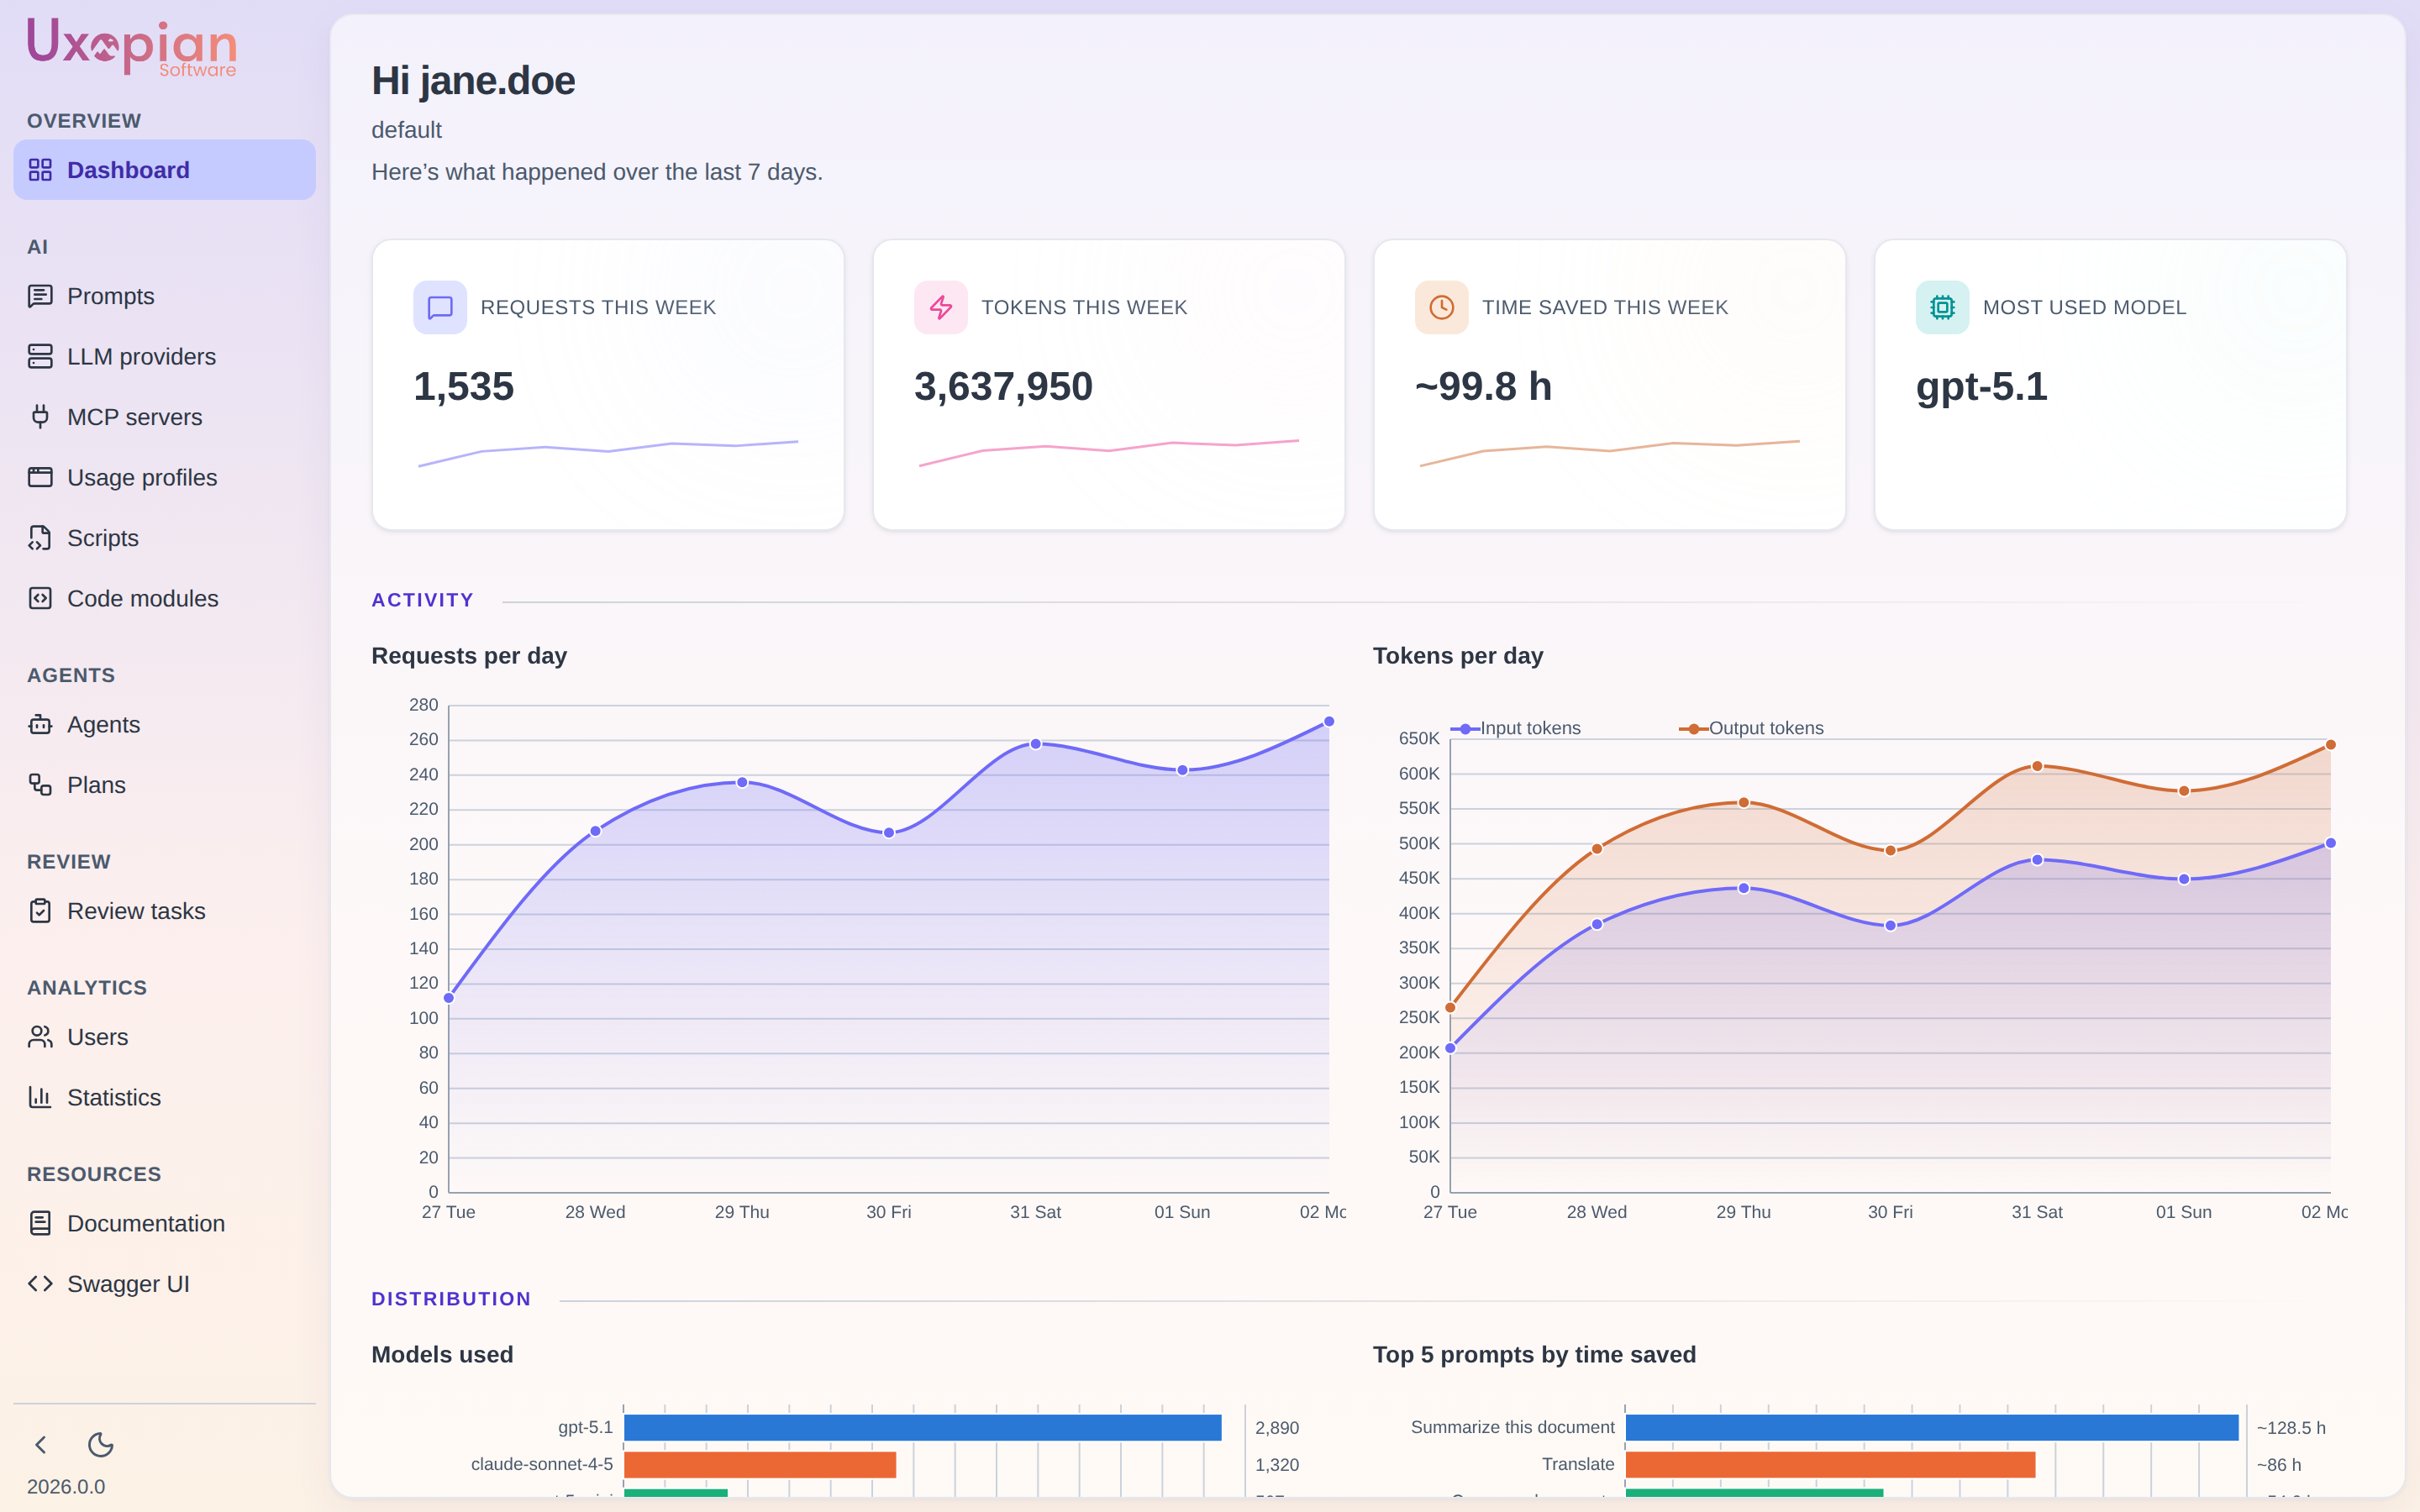
Figure: the dashboard.
Greeting
The page heading reads Hi followed by your user ID, with your tenant ID as subtitle. They come from GET /api/v1/users/me, which returns the id and tenantId of the authenticated caller.
Week at a glance
Four tiles summarize the last week:
| Tile | Description |
|---|---|
| Requests this week | Number of LLM requests processed, with a sparkline |
| Tokens this week | Sum of input and output tokens, with a sparkline. Since 2026.0.0 it counts every completion of a tool-calling loop, not only the last one |
| Time saved this week | Time saved across all prompts, with a sparkline |
| Most used model | The model that served the most requests |
Activity and distribution
- Activity: two charts, Requests per day and Tokens per day.
- Distribution: the LLM usage breakdown by model, and the top prompts by time saved.
Both sections use the same Stats API endpoints as the full Statistics page, with a WEEK interval.
Figure: Dashboard layout.
Resource links
The Documentation and Swagger UI links are at the bottom of the navigation rail. Swagger UI opens the interactive API explorer; its address is resolved from the swaggerEndpoint attribute of the admin element when set, then from apiEndpoint, then from the address the panel is served at. Set swaggerEndpoint to aim the link at the gateway Ingress.